|
|
|
Архитектура Астрономия Аудит Биология Ботаника Бухгалтерский учёт Войное дело Генетика География Геология Дизайн Искусство История Кино Кулинария Культура Литература Математика Медицина Металлургия Мифология Музыка Психология Религия Спорт Строительство Техника Транспорт Туризм Усадьба Физика Фотография Химия Экология Электричество Электроника Энергетика |
Of fund of meat consumption to 1 person/kilos
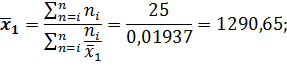
Middle harmonious self-weighted:
Middle quadratic self-weighted:
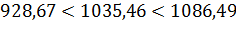
For checking our results we can use the rule of majorities:
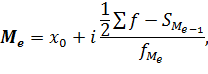
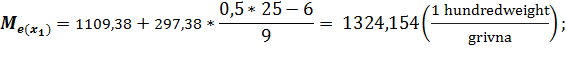
For the average selling price of poultry: For the cost of poultry: For fund of meat consumption to 1 person As we see the rule of majorities executing. Variants name in statistics the size of sign a mode, which more frequent all meets in an aggregate. In interval rows a to distributing mode is determined after such formula:
where
So, let’s check mode of resulting and two factors signs:
Median – it variant which stands in the middle of grade row and divides him in half, that row, located in the order of growth or slump of variants. A median in the interval row of distributing is determined after formula:
where
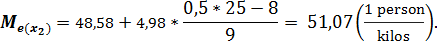
Quartiles - is options that Diehl orderly row on four levels part. The first quartile Q1 separates 25% of population units:
The second quartile is the median. The third quartile isolates 75% of population units:
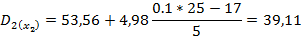
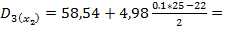
· for The average selling price of poultry :
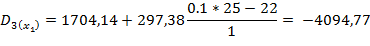
· for The cost of poultry:
· for Fund of meat consumption:
Deciles - is options that divide an ordered series of ten equal parts. Total may be nine deciles.
· for The average selling price of poultry:
· for The cost of poultry:
· for Fund of meat consumption:
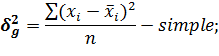
Variance is a size change of an attribute in the statistical set of elements. Variance is a result of natural, climatic, economic, social and other factors' influence on the elements of the set. For the characteristic of variance there are used such factors: range of variance, the average linear deviation, dispersion, the average squared deviation, the coefficient of variance. Range of variance is the difference between the maximum and the minimum values of the varying attribute:
The range of variance gives us information only about the limits of attribute's variation as it considers only two extremes and don't consider deviations of all the variables. For more correct characteristic of attributes variation, their separate values are compared with typical, stable for the whole set level - the average value. As a result of such comparison, the characteristic of variance by a number of deviations from the average is carried out. Average linear deviation is the average from an absolute deviation of all the variables from the average values of the varying attribute. It is determined by next formulas:
The disadvantage of the average linear deviation is that signs of deviations are not considered at its determination. The determination of the general quantity of variance (the sum of squared deviations) is connected with complicated calculations, especially when variables of average value are expressed by decimal fractions. There are certain formulas to make these calculations easier but we won't consider them at the current stage of affairs. Depending on the general quantity of variance, dispersion and the average squared deviations are defined. Dispersion is the average square of deviations of all the values of an attribute from its average value. It is determined by such formulas:
Dispersion can be divided in two types – intergroup and inside-group. Intergroup dispersion characterizes the variation of an attribute under the influence of the researched factors put as a basis of grouping. Intergroup dispersion is an average square of deviations of the group averages in relation to the general average. It is determined by formula:
where
Inside-group dispersion characterizes the variation of an attribute, caused by factors which were non-considered in the process of grouping. It doesn't depend on condition at which the grouping is based and characterizes the variation of an attribute only at a condition of in-group acting factors. Inside-group dispersion is the arithmetic average of the group dispersions, weighted by the quantities of the groups. For the separate groups it is determined as the correlation of the squared deflections sum of the individual values of an attribute from the group averages and the quantity of the set. Inside-group dispersion is determined by the next formulas:
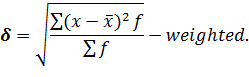
Average squared deviation is determined by defying square root from dispersion:
The average squared deviation characterizes the average variation of an attribute in the set, caused by individual peculiarities of the elements. It is shown in the same units as the variables of the researched attributes are. To compare the sets with different level of the average value of an attribute and the average squared deviation, the coefficient of variance (V) is defined, which is the correlation of the average squared deviation and the average value of an attribute:
TABLE 14
Поиск по сайту: |


 .
. .
. .
.
 – a minimum limit of modal interval;
 – is a size of model interval;
 – is frequency of interval which is preceded to modal;
 – frequency of modal interval;
 – frequency of interval which stands after modal.


 – it is a semi sum of frequencies half (of units of aggregate);
 – the sum story frequencies which stand before a medial interval;
 – frequency of median interval.
 .
.
 756,61
 1383,72
 1117,64
 47,05
47,05 55,30
55,30
 629,24
 215,62
 596,59
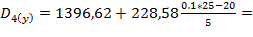 596,59
 993,73
 -1047,625
 9,98
9,98 -43,55


 – an average level of an attribute in a group;
 – the amount of elements in a group;
 – the sum of elements of the set.